Our platform meticulously collects and analyzes data on your trading activity. Whether you trade in the forex, stocks, or cryptocurrency markets, we are prepared to provide you with detailed and valuable information about your trades. From the number of transactions made to the performance of your investments, Swiset will give you a clear and concise view of your results.
Discovering patterns and trends
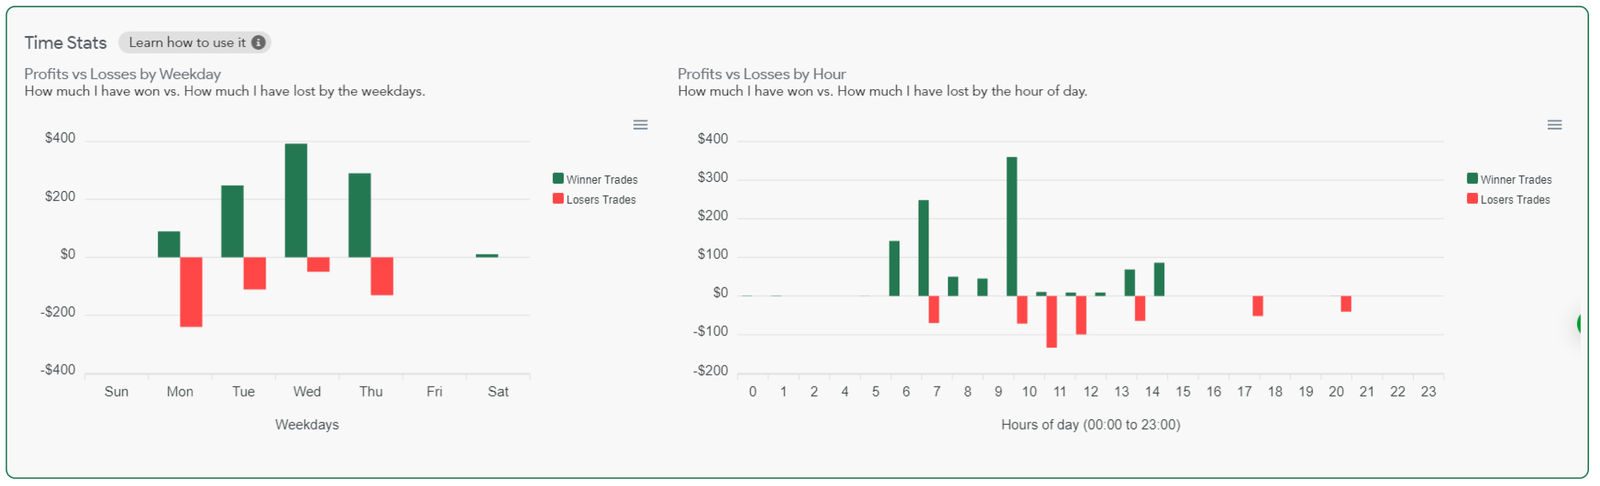
Through interactive graphics and clear visualizations, you can explore your data in an intuitive way and better understand your moments of peak performance, as well as areas where improvement is possible. This knowledge will allow you to adjust your trading strategy and maximize your potential for earnings.
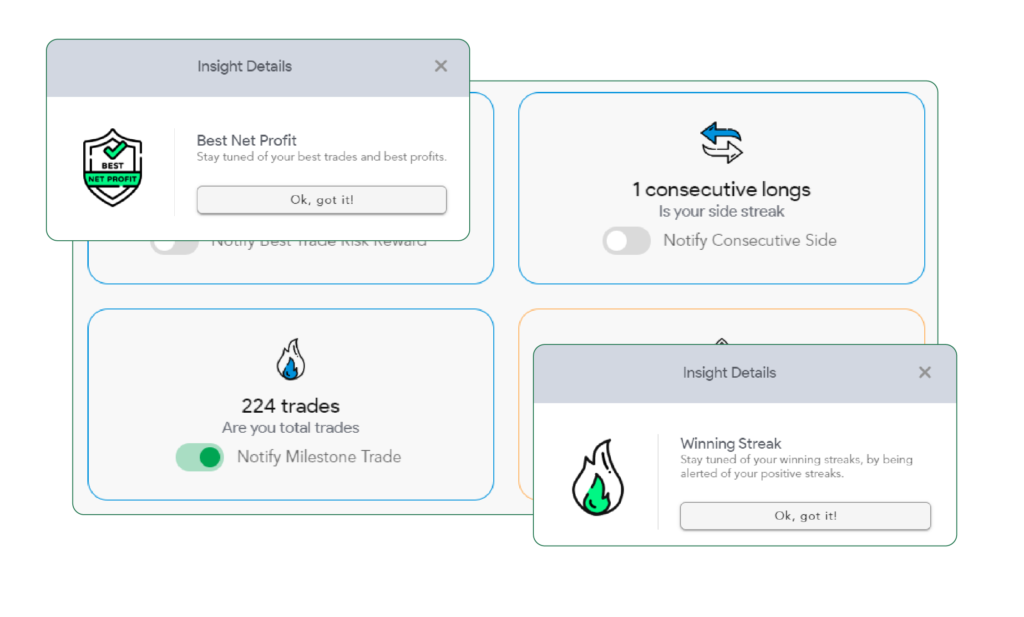
Get valuable insights
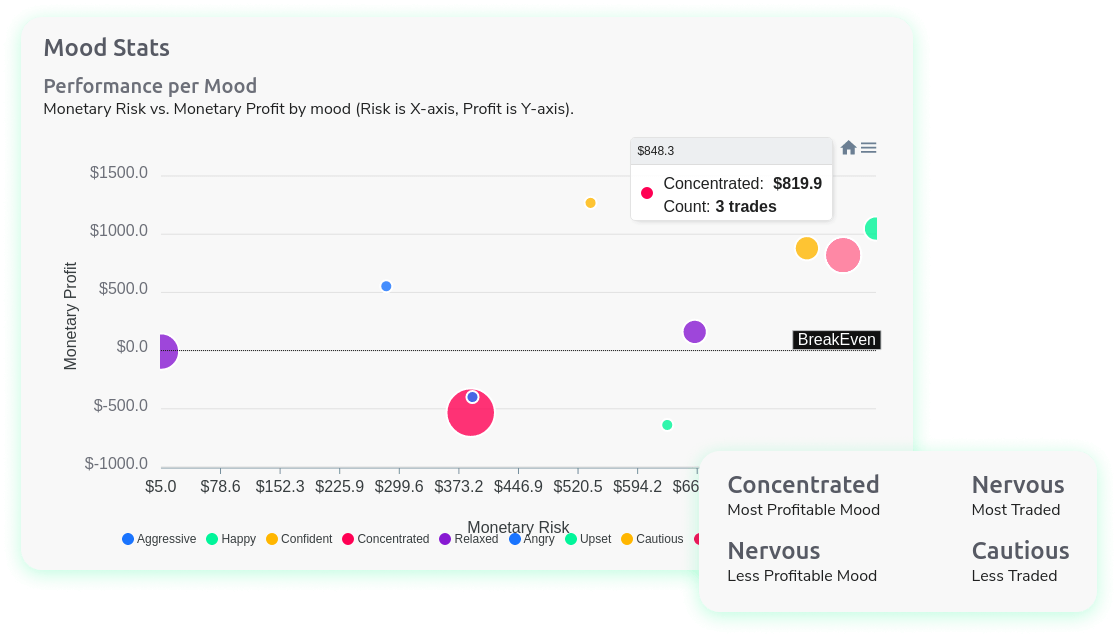
We not only provide you with data, but also insights that will help you interpret the information and make smarter decisions. These insights will allow you to discover improvement opportunities, identify possible risks, and optimize your operations.
#STATS
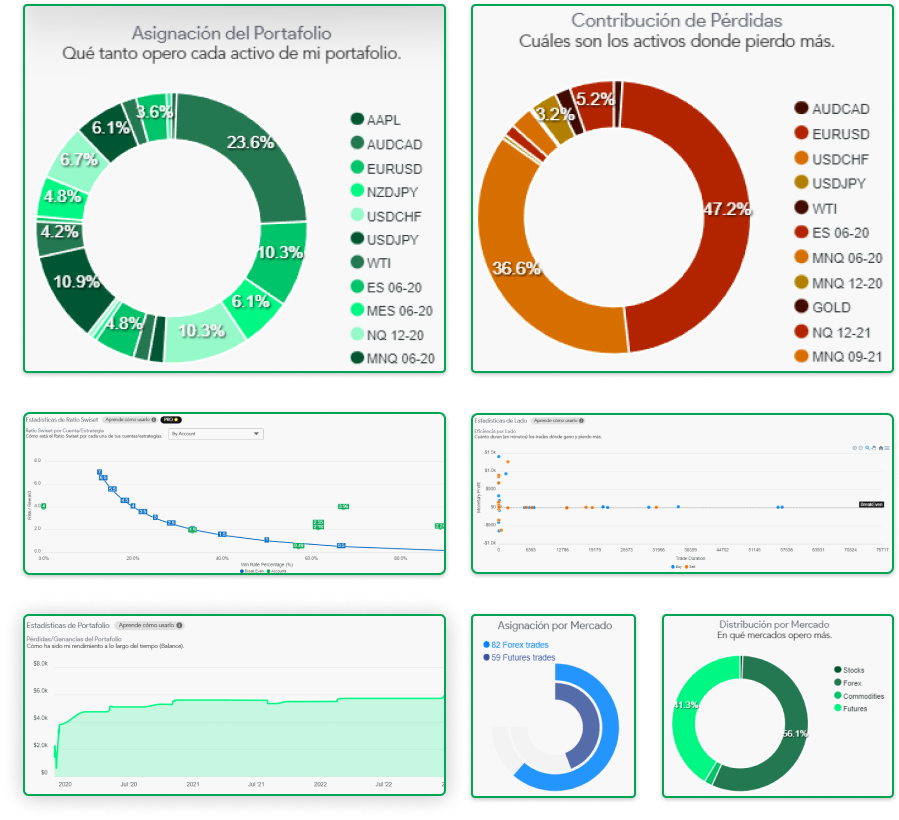
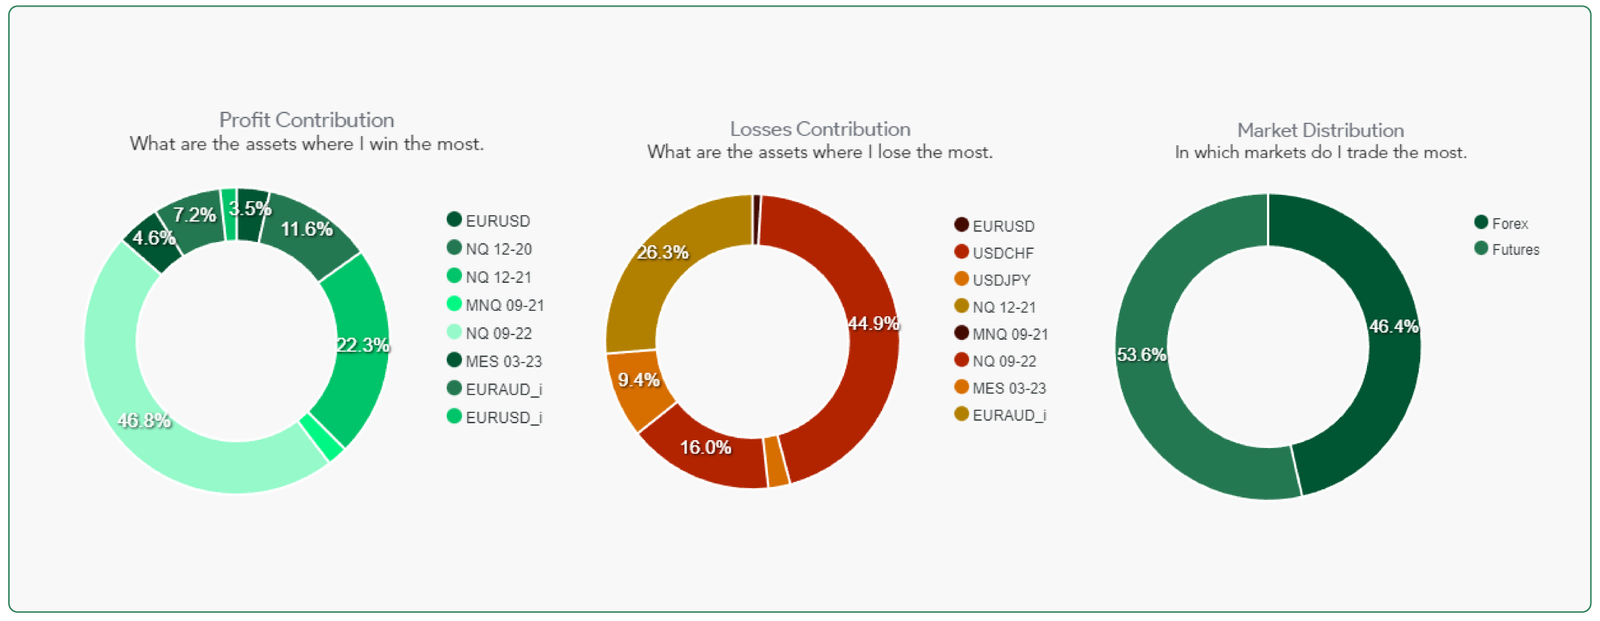
Portfolio Stats
On few seconds, discover the profit/risk relation of your portfolio invesments and trades.
Stay tuned of your P&L, Win Rate, Risk/Reward, Average Trading Time, Total Commissions and many more indicators.
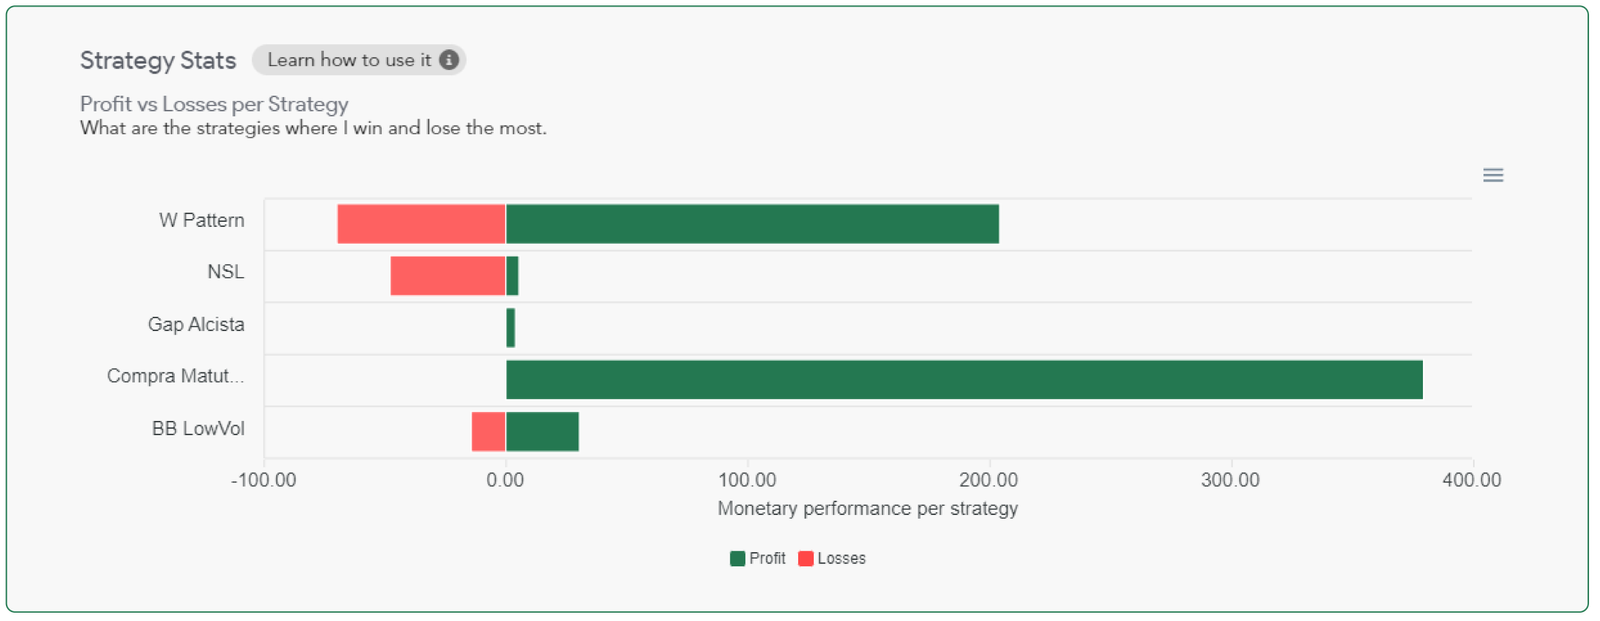
Enhance your risk management by analyzing the performance of your investment/trading strategies. Easily tracking for your technical and fundamental strategies.
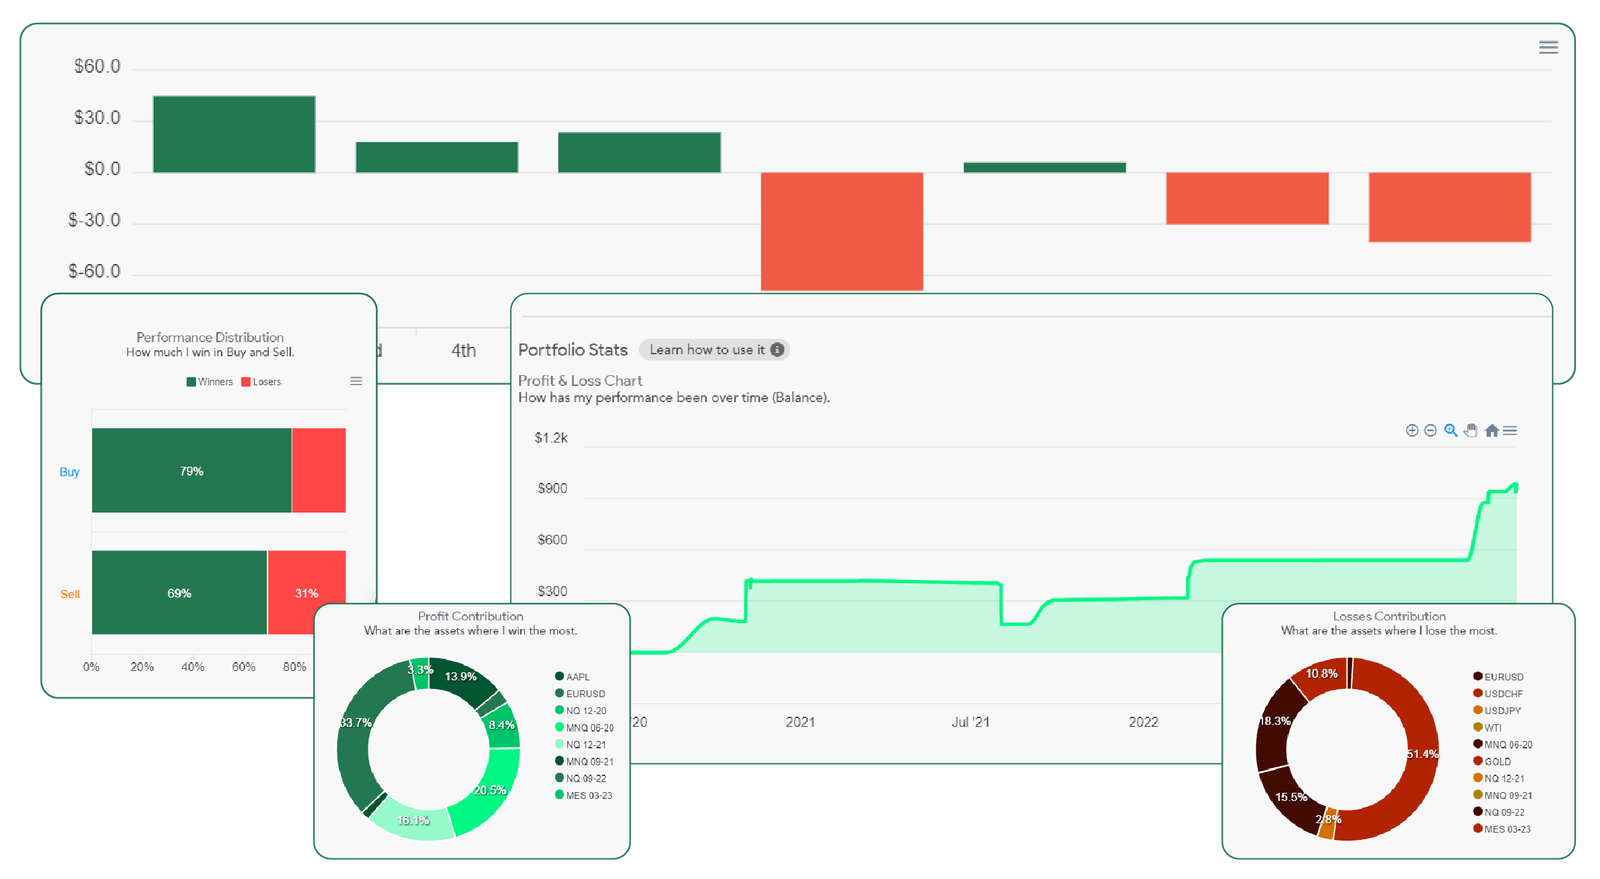
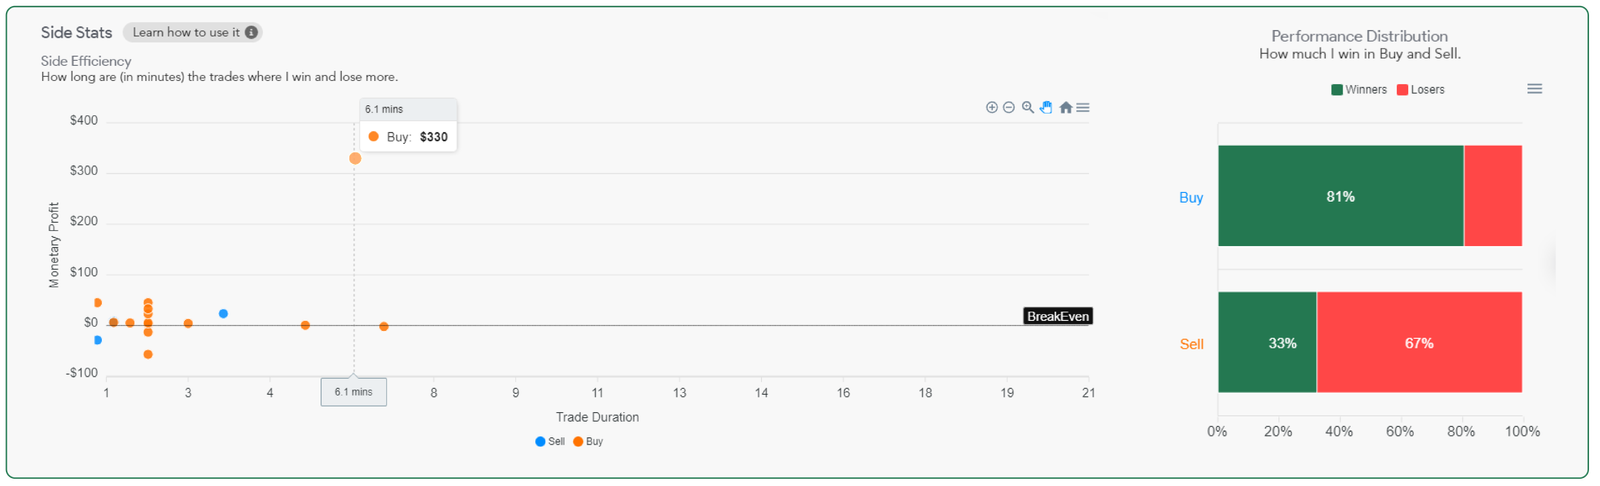
Simplify the way to identify if you are winning/losing many trades in the buy or sell side. Additionally, compare the profit vs. the duration of each trade.
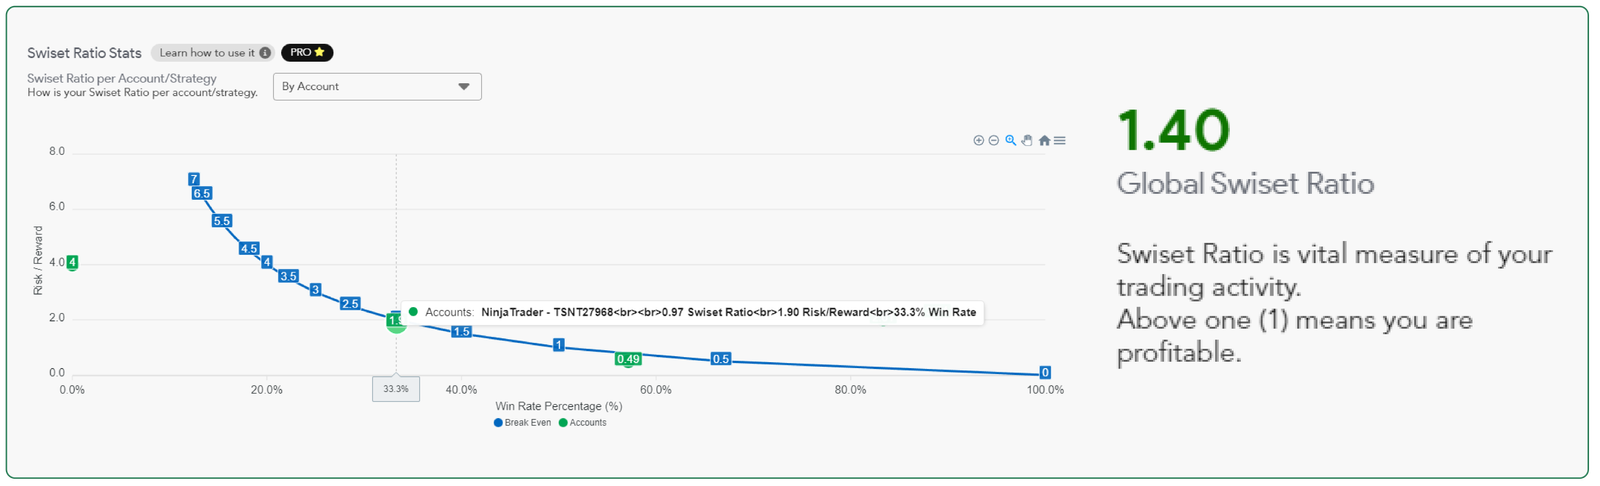
Study your trading accounts/strategies by analyzing our Swiset Ratio Stats. A vital measure of your performance as a trader.
#STATS
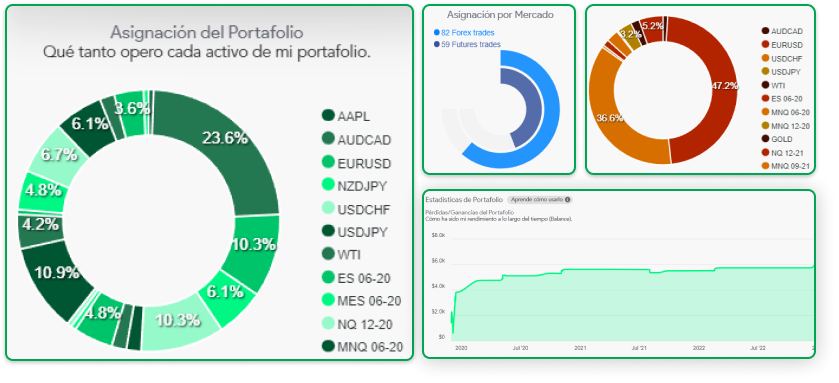
By Market Stats
Get stats by lots, swaps, contracts, MAE, MFE, and many more data by the specific market you trade.
#STATS
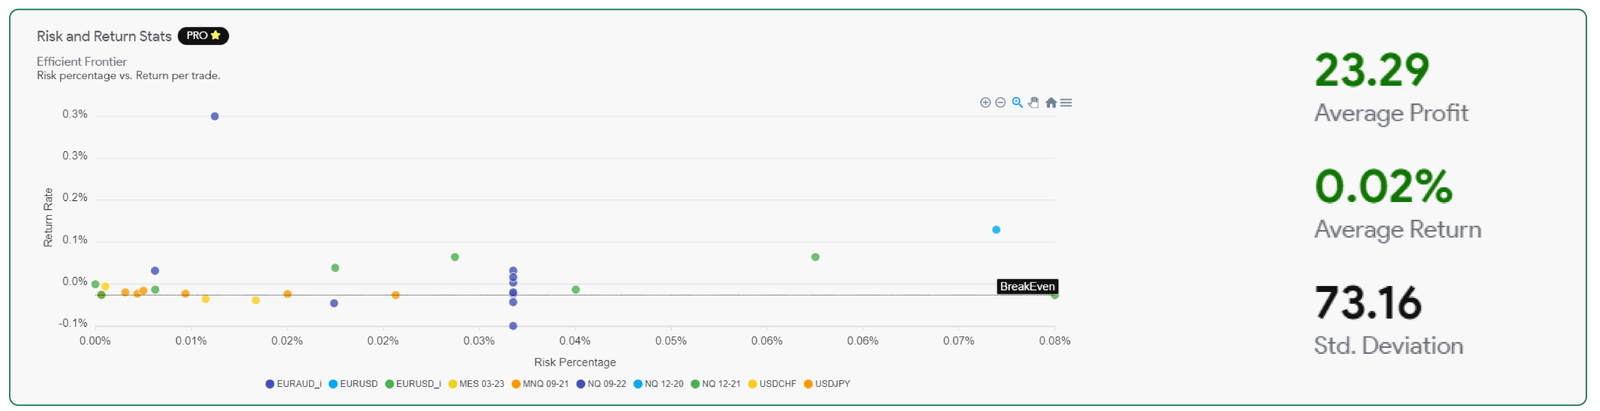
Risk/Return Stats
Identify your risk and return relation per each trade, so you can see anomalies and patterns.
Discover the standard deviation and average profit/return of your trading activity.
#TRADE
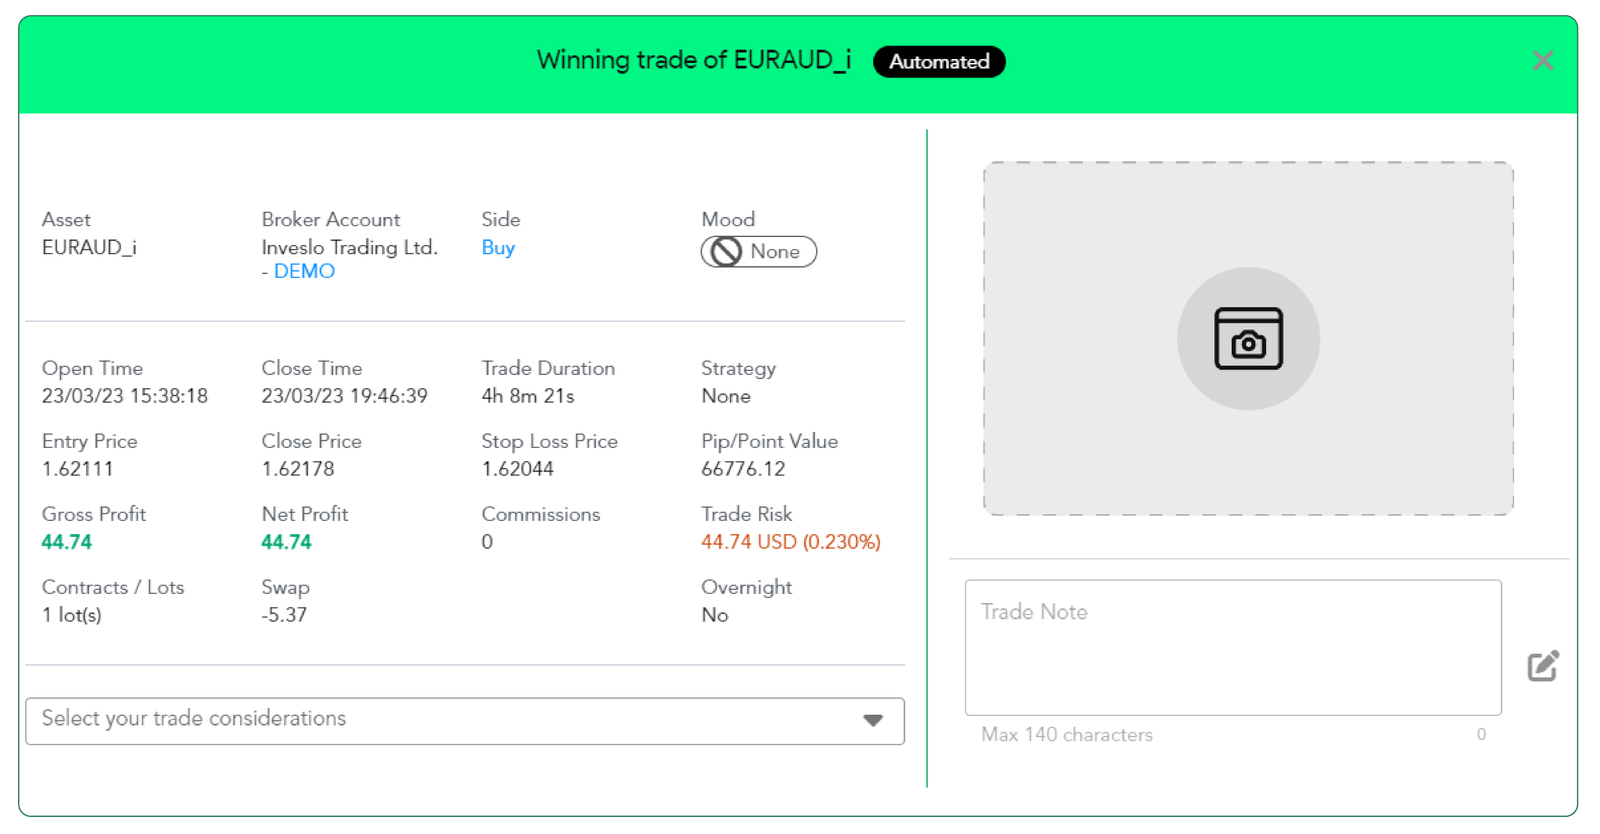
Full Trade
You can see all the details of every trade.
From Trade Time, till risk-related elements. Easily compare some data like “Net Profit vs Monetary Risk“. Even you can save the screencast, some screenshot related with the trade or add tags like Hits/Misktakes.
We use cookies on our website to give you the most relevant experience by remembering your preferences and repeat visits. By clicking “Accept All”, you consent to the use of ALL the cookies. However, you may visit "Cookie Settings" to provide a controlled consent.
This website uses cookies to improve your experience while you navigate through the website. Out of these, the cookies that are categorized as necessary are stored on your browser as they are essential for the working of basic functionalities of the website. We also use third-party cookies that help us analyze and understand how you use this website. These cookies will be stored in your browser only with your consent. You also have the option to opt-out of these cookies. But opting out of some of these cookies may affect your browsing experience.
Necessary cookies are absolutely essential for the website to function properly. These cookies ensure basic functionalities and security features of the website, anonymously.
Cookie
Duration
Description
cookielawinfo-checkbox-analytics
11 months
This cookie is set by GDPR Cookie Consent plugin. The cookie is used to store the user consent for the cookies in the category "Analytics".
cookielawinfo-checkbox-functional
11 months
The cookie is set by GDPR cookie consent to record the user consent for the cookies in the category "Functional".
cookielawinfo-checkbox-necessary
11 months
This cookie is set by GDPR Cookie Consent plugin. The cookies is used to store the user consent for the cookies in the category "Necessary".
cookielawinfo-checkbox-others
11 months
This cookie is set by GDPR Cookie Consent plugin. The cookie is used to store the user consent for the cookies in the category "Other.
cookielawinfo-checkbox-performance
11 months
This cookie is set by GDPR Cookie Consent plugin. The cookie is used to store the user consent for the cookies in the category "Performance".
viewed_cookie_policy
11 months
The cookie is set by the GDPR Cookie Consent plugin and is used to store whether or not user has consented to the use of cookies. It does not store any personal data.
Functional cookies help to perform certain functionalities like sharing the content of the website on social media platforms, collect feedbacks, and other third-party features.
Performance cookies are used to understand and analyze the key performance indexes of the website which helps in delivering a better user experience for the visitors.
Analytical cookies are used to understand how visitors interact with the website. These cookies help provide information on metrics the number of visitors, bounce rate, traffic source, etc.
Advertisement cookies are used to provide visitors with relevant ads and marketing campaigns. These cookies track visitors across websites and collect information to provide customized ads.